

 FR
FRTechnical Focus on SIMGAB
In this article we shall be highlighting the technical aspects of the SIMGAB (gauge clearance simulation) software on which we reported in our previous newsletter.
The article has been compiled on the basis of input from Rémy DRON, Clément BASSET, Danilo SORRENTINO and Frédéric DESGACHES (Project Managers SimGab for SNCF Réseau and SNCF Mobilités) as well as Claude DOSSMAN and Ségolène LE SCOUEZEC (gauge experts CIM and SNCF Réseau).
In the past, checks were conducted to ensure that vehicles would not foul the clearance gauge by applying the very strict vehicle displacement and positioning recommendations of EN 15273 (UIC Leaflet 505-1). Since multibody simulation now offers a way of arriving at an accurate appreciation of rail vehicle behaviour (single vehicle, articulated trainset, special wagons, etc.) for all types of theoretical or actual track and for all running configurations, it is possible to define the maximum range of vehicle displacement in greater detail.
The new SIMGAB software developed by DGII VA (SNCF Réseau) and the CIM (Rolling Stock Engineering Centre) offers this possibility.
Software goals :
- Retrieving the results of SIMPACK simulations (absolute displacement in space of crucial points with regard to gauge clearance for a given longitudinal position on a vehicle body) obtained from running the vehicle along track with a specific profile offering a combination of all or some of the following factors: straight section of track, beginning or end of curve, mid-curve, staggered cant, presence of turnouts, etc.
- Applying the limiting values for clearance gauge verifications (G1 and FR 3.3…or any other gauge that the user chooses), working from the reference profiles given in IC001621 (calculation of margins as a function of the position of the cross section of the vehicle when travelling along a straight section of line, negotiating a curve with or without cant, etc.)
- Making allowance for the presence of platforms (IN 01632)
- Identifying the physical location of potential friction points between the outer envelope of points on the vehicle cross section in relation to the limiting values of the applicable reference profile
- Visualising the potential friction points for a given vehicle cross section over the entire distance of the route selected
Important technical definitions :
Kinematic gauge is used for judging whether Rolling Stock can be accepted on the French national rail network (RFN). The principles governing the reference profile of the kinematic gauge and the corresponding rules are agreed between the mechanical and civil engineers (rolling stock and infrastructure)
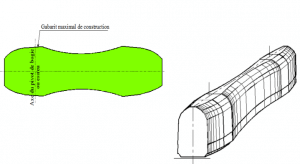
The maximum structure gauge is calculated on the basis of the reference profile (for the particular clearance gauge selected) as are the rules that must apply, these depending on:
– Z displacements (deflection of suspension, bounce, etc.)
– Y displacements (variations in track geometry, excess play or cant deficiency, quasi-static effects).
– Overhang
The actual rolling stock does not make full use of the maximum structure gauge, and the space left can therefore be used to equip vehicles with fitting such as steps, etc.
Nominal structure gauge (profile N, profile N + to allow for out of gauge loads, profile P, profile Nc)
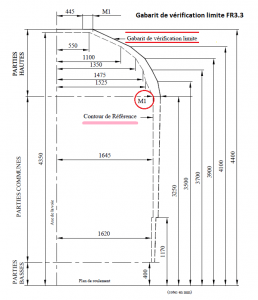
Maximum structure position gauge: (G1, FR3.3, G2, GA, GB, GB1, GC), these reference profiles relating to the track, within no obstacle presence is accepted (M2)
Maximum verification gauge: (G1, FR3.3, G2, GA, GB, GB1, GC) these reference profiles relating to the track, which must under no circumstances be fouled (M1)
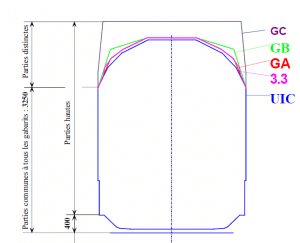
Reference profiles for the different clearance gauges and the corresponding rules
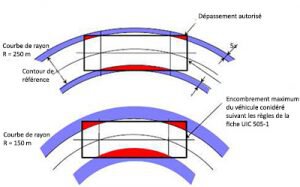
Overhangs are cases where the reference profile is fouled in curves but where exceptions are granted for the rolling stock concerned. The overhang that may be accepted depends on:
– The side of the curve involved
– Curve radius
– Type of gauge (e.g.: overhang manipulation FR3.3)
– Situation in the curve: gradual transition curves, start or end of curve without gradual transition, presence of turnouts
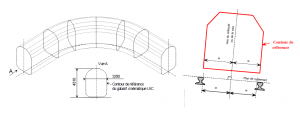
The maximum verification gauge for structures is obtained by increasing the horizontal dimensions of the reference profile half widths of the margin M1 calculated according to the rules applicable to the type of profile.
These rules, which enable the margin M1 to be calculated for a given curvilinear abscissa on the track, depend on the:
– Situation in the common section (H ≤ 3.25m) or upper section (H > 3.25m)
– Inner or outer side of the curve
– Running conditions on straight sections or in curves–> (Cant, cant deficiency, speed)
– Si or Sa overhang depending on the particular case
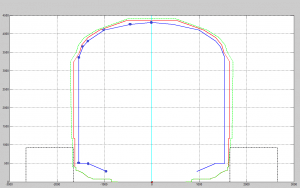
Application of the method by visualising potential points of conflict
For the tests with SIMGAB, the RATP’s Test and Measurement Laboratory (LEM) was called in to establish the distance between the rail and a wheel on the VE144 test vehicle when in movement. To fulfil this task and to make allowance for the difficulties in fitting standard measuring equipment in the area selected, LEM volunteered to develop and apply a method involving acquiring images via high-speed video cameras and processing them using analysis software.
This method, which is normally used at LEM for 2D analyses (physical dimensions measured in the focal plane of the camera), was adapted for 3D analysis in order to establish displacement in relation to the perpendicular axis at the surface of the wheel with sensors placed at bogie pivot level. Following a series of experiments on the AEF site, the measuring equipment finally used for the tests comprised:
– Two high-frequency cameras for capturing the image sequences and setting a system of orthonormal coordinates (Photo 1),
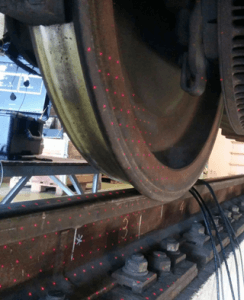
– A laser matrix with points located on the wheel and the rail to create clearly visible targets, easily exploitable during post-processing operations (Photo 2),
– Lighting suitably adapted to running conditions.
Post-processing operations consisted of establishing the distance for each visible point on the wheel and the rail along the focal axis initially agreed. The data for the different vehicle movements was processed, thereby confirming, in particular, the degrees of development recorded by the other measuring equipment fitted by AEF.
Ultimately, this innovative test procedure using cutting-edge technology applied to railways signalled a new era for dynamic measurements of the distances between wheel and rail.
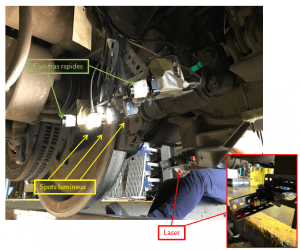
Picture 1 : Installation of the measuring equipment
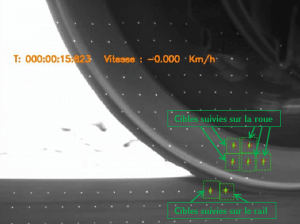
Picture 2 : Post-processing target analysis
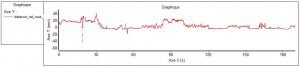
Figure 1 : Example of results (distance between inner surface and rail head plotted against time)